User interface of CAVIAR
Quick walkthrough of the GUI

Written by Jean-Rémy Marchand
5 minute read
First, make sure you have installed CAVIAR and activated the environment (–> installation <–).
Calling the GUI
In the terminal where you have activate the CAVIAR environment, write down:
caviar_gui
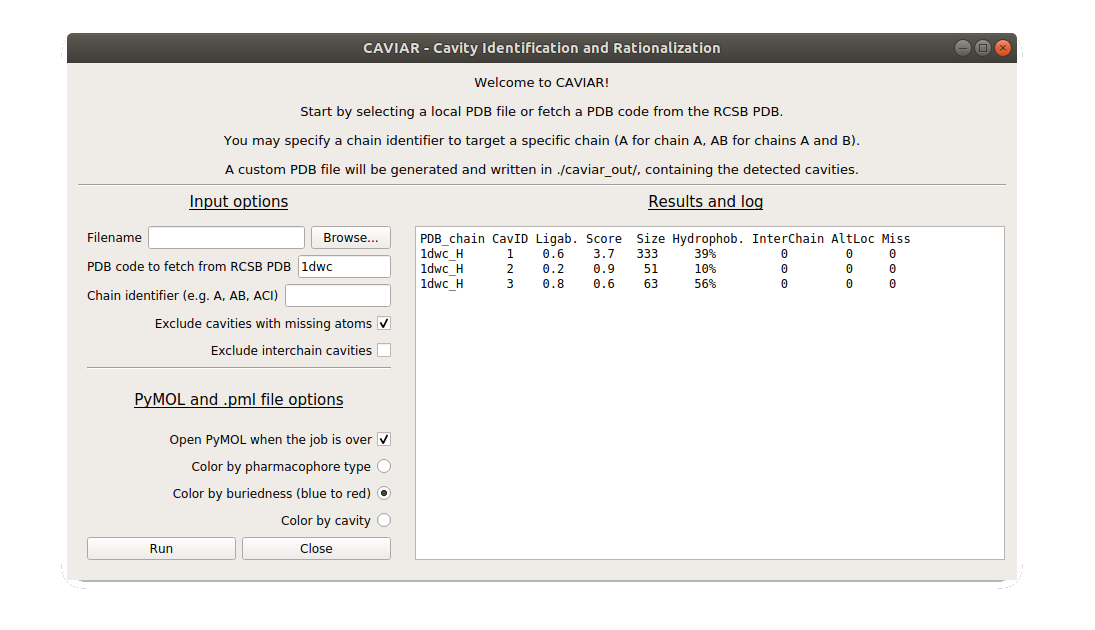
This will open the main window of CAVIAR, focused on cavity identification.

Input options
You can either select a local file with the browse button or indicate a PDB code in the corresponding input area. The PDB file will be downloaded from the RCSB PDB website in your local directory.
The next input area is about the chain identifier: do you already know this PDB file and are you interested only in chain A of the protein complex? If you want to investigate more than one chain, just specify them consecutively (e.g. ABC for chains A, B, and C). By default, all protein chains are retained and investigated.
The two following clickable options are made to reduce spurious cavities that contain missing atoms or cavities that are at the interface between two protein chains. Some interfaces are spurious (crystal contacts), some are productive (biological interfaces), so it can be interesting in some cases to ignore interchain cavities.
PyMOL options
If PyMOL is installed and callable from the terminal as pymol, it can be directly called from the GUI. A PyMOL session file is written to help visualizing cavities. Cavity grid points can be colored by buriedness, pharmacophore type (corresponding to the protein environment), or simply by cavity (different cavities are colored differently).
Results display area
The output is visualized in the right panel as a table that contains the list of identified cavities, ranked by cavity score. For example:
| PDB_chain | CavID | Ligab. | Score | Size | Hydrophob | InterChain | AltLoc | Miss |
|---|---|---|---|---|---|---|---|---|
| 1dwc_H | 1 | 0.6 | 3.7 | 333 | 39% | 0 | 0 | 0 |
| 1dwc_H | 2 | 0.2 | 0.9 | 51 | 10% | 0 | 0 | 0 |
| 1dwc_H | 3 | 0.8 | 0.6 | 63 | 56% | 0 | 0 | 0 |
- PDB_chain = PDB code underscore chain identifier (here, PDB 1dwc, chain H)
- CavID = cavity identifier
- Ligab. = ligandability estimator
- [0.0 - 0.2] = likely hard to ligand
- [0.4 - 0.6] = not conclusive
- [0.8 - 1.0] = probably easy to ligand
- Score = cavity score, scales with size and buriedness: the bigger and the more buried, the higher the score.
- Size = cavity size, in grid points. With a grid spacing of 1A (default), can represent a volume in A^3.
- Hydrophob = hydrophobicity, count of aliphatic+aromatic grid points / total number of grid points.
- InterChain = is the cavity in between two protein chains? (Boolean) Some interfaces are spurious (crystal contacts), some are productive (biological interfaces). Please keep that in mind when analysing the results.
- AltLoc = Does the cavity contain residues alternate locations? (Boolean)
- Miss = Does the cavity contain missing atoms or residues? (Boolean) We advise to be very careful with cavities containing missing atoms, as they may be very noisy or even spurious.
Subcavity window
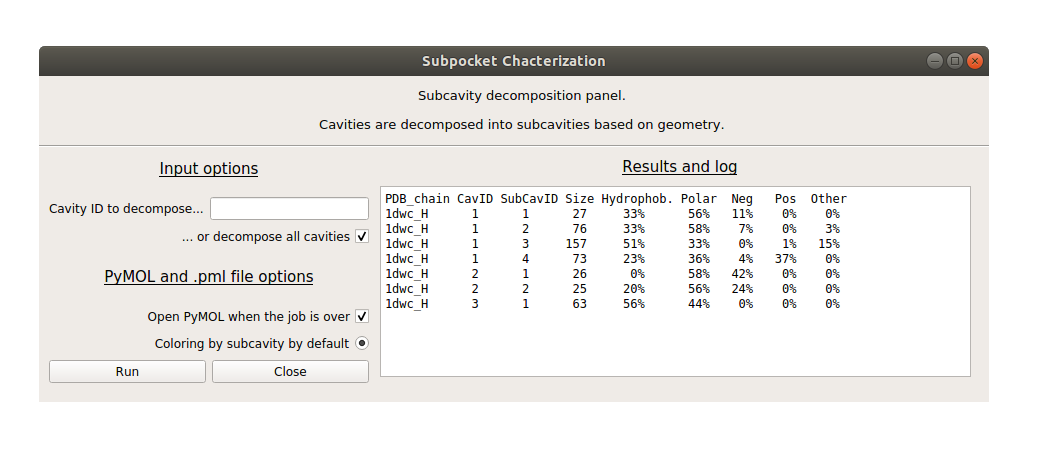
Once the cavity identification run is finished, a second window for subcavity segmentation will open, as well as a PyMOL session if selected.
By default, all cavities are decomposed into subcavities, but you can specify a certain cavity ID as input if you are only interested in that cavity. The cavity ID corresponds to the numbering in the first table, as well as the cavity residue index in PyMOL.
Similarly, PyMOL can be called from the GUI, with a session coloring subcavities automatically for easy visualization.

| PDB_chain | CavID | SubCavID | Size | Hydrophob. | Polar | Neg | Pos | Other |
|---|---|---|---|---|---|---|---|---|
| 1dwc_H | 1 | 1 | 27 | 33% | 56% | 11% | 0% | 0% |
| 1dwc_H | 1 | 2 | 76 | 33% | 58% | 7% | 0% | 3% |
| 1dwc_H | 1 | 3 | 157 | 51% | 33% | 0% | 1% | 15% |
| 1dwc_H | 1 | 4 | 73 | 23% | 36% | 4% | 37% | 0% |
| 1dwc_H | 2 | 1 | 26 | 0% | 58% | 42% | 0% | 0% |
| 1dwc_H | 2 | 2 | 25 | 20% | 56% | 24% | 0% | 0% |
| 1dwc_H | 3 | 1 | 63 | 56% | 44% | 0% | 0% | 0% |
- PDB_chain = PDB code underscore chain identifier (here, PDB 1dwc, chain H).
- CavID = cavity identifier.
- SubCavID = Subcavity identifier.
- Size = Subcavity size.
- Hydrophob. = Percentage of hydrophobic grid points (aliphatic + aromatic).
- Polar = Percentage of polar grid points (hydrogen bond donors or acceptors).
- Neg = Percentage of negatively charged grid points.
- Pos = Percentage of positively charged grid points.
- Other = Percentage of “other” grid points: S atom of CYS, ring of HIS, metal.
Note that the types are assigned corresponding the the closest atom from the protein. In the case of charged pharmacophores. Rounded up values, thus sums can differ slightly from 100%.
Still Need Help?
CAVIAR Bugs
If you find any bugs or problems with this theme, please open an issue over on GitHub.
GitHubFeel free to tweet at me if you have suggestions for CAVIAR. Or if you just want to say hi.
Twitter